
From Landfills to Oceans: Breakdown of U.S. Landfills by State and Waste Disposal Destinations
Introduction
Waste management is a growing environmental and economic challenge in the United States. With landfills reaching capacity in many regions and waste generation continuing to rise, states are adopting different strategies to manage their trash. The United States faces a mounting waste crisis, generating over 12% of the world’s municipal solid waste despite having less than 5% of the population. With landfills projected to reach capacity by 2036 and 80% of landfill waste being recyclable, mismanagement continues to harm the environment. Beyond landfills, plastic pollution is choking waterways, threatening marine life, and endangering ecosystems. As the nation struggles with excessive waste production and inadequate recycling, the consequences for sustainability and public health grow more severe. Without immediate action through improved waste management, policy reforms, and sustainable practices, the U.S. risks long-term environmental and societal damage. Some states, like Pennsylvania and Michigan, import large amounts of waste from neighbouring regions, while others face landfill shortages that drive up disposal costs (Monica Sanders, 2025).
At the same time, international waste policies—such as China’s ban on imported waste have reshaped global waste flows, forcing the U.S. to find alternative solutions. Beyond landfills, improper waste disposal has contributed to the global pollution crisis, with millions of tons of plastic and hazardous materials entering the oceans each year. While international agreements like MARPOL and the London Convention have restricted direct ocean dumping, mismanaged waste from coastal populations and river systems continues to fuel marine pollution (Jeff Turrentine, 2019).
This article explores landfill capacity by state, dumped waste in the oceans, and the environmental impact of waste exports, highlighting key facts, figures, and the broader implications for sustainability.
Asia’s Plastic Crisis: How Five Nations Are Choking the World’s Oceans
Currently, an estimated 75 to 199 million tons of plastic waste pollute the world’s oceans, with an additional 33 billion pounds of plastic entering marine environments each year. The rate at which plastic is being produced and discarded has far outpaced the capacity of waste management and recycling systems, creating an escalating environmental crisis (Chloe Fisher, 2024).
Asia’s plastic pollution crisis is one of the most severe environmental threats facing our oceans. The Association of Southeast Asian Nations (ASEAN) member states—particularly China, Indonesia, the Philippines, Vietnam, and Thailand—are among the world’s largest contributors to marine plastic waste. According to a 2017 report by the Ocean Conservancy and the McKinsey Center for Business and Environment, these five nations alone are responsible for over 50% of the plastic waste polluting the world’s oceans (Johnny Wood, 2018).
These nations have experienced a rapid increase in consumer product demand, but their waste management systems have been unable to keep pace with the surge in plastic waste. Globally, an estimated 8 million tons of plastic end up in the ocean each year—equivalent to one garbage truck of plastic being dumped into the sea every minute. If this trend continues, the total volume of plastic waste in the ocean could double to 250 million tones by 2025, as projected by Ocean Conservancy. Even more alarming, a World Economic Forum report warns that by 2050, plastic could outweigh fish in the ocean if immediate action is not taken (Jenny Vaughan, 2018).
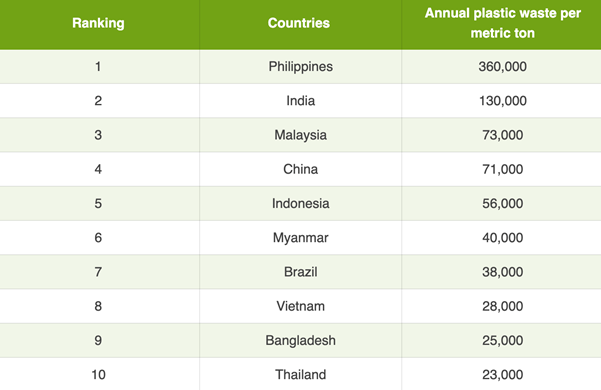
On the other hand, Philippines is an archipelago of over 7,000 islands, with a 36,289 kilometre coastline and 4,820 plastic emitting rivers is estimated to emit 35% of the ocean’s plastic.
In addition to the Philippines, over 75% of the accumulated plastic in the ocean is reported to come from the mismanaged waste in Asian countries including India, Malaysia, China, Indonesia, Myanmar, Vietnam, Bangladesh, and Thailand (Louis Lugas, 2023).
Scale of Waste Entering Oceans: How Much Waste is Entering to Oceans?
Estimated Annual Waste Dumped into Oceans
Total Waste: Approximately 8 to 14 million metric tons of plastic waste alone enter the oceans every year, according to research by the Ocean Conservancy and the International Union for Conservation of Nature (IUCN).
Projected Growth: If current trends continue, the amount of plastic waste entering oceans could triple to 29 million metric tons per year by 2040 (Hannah Ritchie, Veronika Samborska, Max Roser, 2022).
Breakdown of Waste Types
Plastic Waste:
- Percentage: 80% of all marine debris.
- Examples: Single-use plastics (bottles, bags, straws), micro plastics, and abandoned fishing gear.
- Volume: Over 11 million metric tons of plastic enter oceans annually.
Fishing Gear (Ghost Gear):
- Percentage: 10% of marine debris.
- Examples: Abandoned or lost fishing nets, lines, and traps.
- Impact: Ghost gear is particularly harmful as it continues to trap and kill marine life (a phenomenon known as “ghost fishing”).
Oil Pollution:
- Sources: Oil spills, offshore drilling, and routine ship maintenance.
- Volume: Approximately 1.3 million metric tons of oil enter oceans annually.
- Impact: Oil spills devastate marine ecosystems, coating wildlife and damaging habitats.
Sewage and Agricultural Runoff:
- Sources: Untreated sewage, fertilizers, and pesticides from agricultural activities.
- Impact: Leads to nutrient pollution, causing harmful algal blooms and dead zones.
Industrial Waste:
- Examples: Heavy metals, chemicals, and toxic waste from manufacturing processes.
- Impact: Contaminates water and accumulates in marine organisms, entering the food chain.
Atmospheric Deposition:
- Examples: Micro plastics and chemical pollutants carried by wind and deposited into oceans.
- Impact: Contributes to the growing problem of micro plastic pollution.
The study suggest it would be worse if the same trends go on it would be devastating for the marine life especially (Chloe Fisher, 2024).
Major Sources of Marine Pollution
Mismanaged Waste from Coastal Populations
Problem: Coastal cities and communities often lack proper waste management infrastructure, leading to litter and waste being washed into the ocean.
Examples: In Southeast Asia, countries like Indonesia, the Philippines, and Vietnam are among the top contributors to ocean plastic due to inadequate waste disposal systems.
In the U.S., coastal cities like Los Angeles and New York contribute to marine pollution through storm water runoff carrying litter into the ocean.
River Systems Transporting Waste from Inland Areas
Problem: Rivers act as conduits for waste, carrying plastic, chemicals, and other pollutants from inland areas to the ocean.
Key Rivers: The Yangtze River in China is the largest contributor of plastic waste to the oceans.
Statistics: The top 10 rivers contribute 90% of the plastic waste entering oceans from rivers.
The Ganges River in India and the Nile River in Africa are also significant sources of marine pollution (NOAA, 2024).
Great Pacific Garbage Patch
The Great Pacific Garbage Patch is a vast and growing environmental crisis, spanning 1.6 million square kilometres and accumulating tens of thousands of metric tons of plastic. Despite clean-up efforts, only a fraction of the waste has been removed, while plastic continues to enter the ocean at an alarming rate. The patch consists mostly of micro plastics and larger debris, some over 50 years old, including everyday items like water bottles, toothbrushes, and plastic bags. With plastic outnumbering plankton by weight and similar patches forming in other oceans, urgent global action is needed to reduce plastic waste, improve waste management, and protect marine ecosystems. The collection of plastic and floating trash originates from the Pacific Rim including countries in Asia, North America, and South America (Wikipedia, 2024).
The State of Landfill Capacity in the U.S.
Overview of Landfill Use in the U.S.
In past decades, nearly every U.S. town maintained its own dump, leading to the existence of over 10,000 old municipal landfills, according to the Environmental Protection Agency (EPA). This landscape shifted in the 1970s when federal regulations mandated landfills to install lining systems to prevent leachate leakage, enhancing environmental protection.
Consequently, the number of active landfills decreased from over 7,600 in the mid-1980s to approximately 1,900 by 2013. However, these operational landfills have become larger and more efficient than their predecessors.
According to the EPA’s most recent data, Americans generated about 292.4 million tons of municipal solid waste (MSW) in 2018, recycling or composting approximately 94 million tons, resulting in a 32.1% recycling and composting rate.
According to the data of 2022, the United States generated approximately 300 million tons of MSW, with about 95 million tons recycled or composted, maintaining a recycling and composting rate around 32%. The amount of waste directed to landfills has remained relatively stable, with slight fluctuations over the years.
As of September 2024, the United States has over 1,200 active municipals solid waste (MSW) landfills. This number represents a significant decrease from the 1980s, when there were over 7,600 active landfills. The decline is primarily due to stricter environmental regulations and the consolidation of waste management operations, leading to fewer but larger and more efficient landfills.
It’s important to note that while the number of active landfills has decreased, the total capacity for waste disposal has not necessarily diminished. Modern landfills are designed to handle larger volumes of waste and incorporate advanced technologies to minimize environmental impact. Additionally, there are more than 1,300 closed MSW landfills in the United States, which continue to emit gases, including methane, after closure.
These trends underscore the ongoing evolution of waste management practices in the U.S., with an emphasis on environmental protection and operational efficiency (Rachael Zimlich, 2015).
Key Statistics on U.S. Waste Generation and Landfill Reliance
- The U.S. generates approximately 292.4 million tons of municipal solid waste annually (EPA, latest data).
- Around 50% of this waste is sent to landfills, while the rest is recycled, composted, or converted to energy.
- The average American produces about 4.9 pounds of waste per day, with landfills handling the bulk of non-recycled materials.
- There are over 1,250 active municipal solid waste landfills across the country, but their capacity is shrinking (Statista, 2024).
Largest Municipal Solid Waste Landfills in the United States
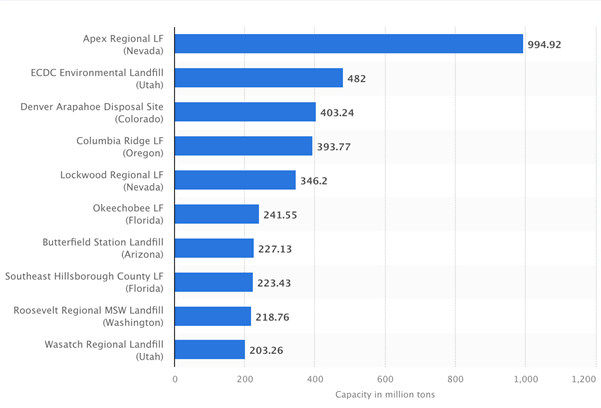
According to the data of 2024, the United States continues to rely on large-scale municipal solid waste (MSW) landfills to manage its growing waste production efficiently while adhering to environmental regulations. The largest landfills are primarily found in states with ample land availability and lower population densities, such as Nevada, Utah, and Florida. The Apex Regional Landfill in Nevada is by far the largest, with a massive design capacity of 994.92 million tons, more than double that of the second-largest landfill, ECDC Environmental Landfill in Utah (482 million tons). Other significant landfills include the Denver Arapahoe Disposal Site in Colorado (403.24 million tons), Columbia Ridge Landfill in Oregon (393.77 million tons), and Lockwood Regional Landfill in Nevada (346.2 million tons). Florida also has major waste facilities like the Okeechobee Landfill and Southeast Hillsborough County Landfill, each with capacities exceeding 200 million tons. These massive landfills highlight the ongoing need for large-scale waste disposal infrastructure, particularly in states with the necessary space and regulatory flexibility. However, regional waste management strategies vary, with some states investing more in recycling and waste-to-energy solutions to reduce landfill dependency. While the total number of active landfills has declined over the years, these high-capacity sites continue to play a crucial role in handling the nation’s waste efficiently (Statista, 2024).
Breakdown of U.S. Landfills by State
As of September 2024, the U.S. Environmental Protection Agency’s (EPA) Landfill Methane Outreach Program (LMOP) provides detailed data on municipal solid waste (MSW) landfills and landfill gas (LFG) energy projects across the United States. This information offers valuable insights into waste management practices, including the number of operational LFG energy projects, candidate landfills, and total landfills by state (EPA, 2024).
State-by-State Breakdown:
Below is a detailed overview of landfill data by state, reflecting the latest figures from the LMOP database as of September 2024:
| State | Operational Projects | Candidate Landfills | Total Landfills |
| Alabama | 4 | 15 | 43 |
| Alaska | 1 | 3 | 8 |
| Arizona | 1 | 18 | 40 |
| Arkansas | 3 | 14 | 29 |
| California | 53 | 33 | 299 |
| Colorado | 2 | 15 | 37 |
| Connecticut | 2 | 1 | 24 |
| Delaware | 4 | 0 | 4 |
| Florida | 24 | 12 | 75 |
| Georgia | 17 | 22 | 77 |
| Hawaii | 1 | 1 | 10 |
| Idaho | 0 | 5 | 17 |
| Illinois | 18 | 18 | 96 |
| Indiana | 16 | 8 | 65 |
| Iowa | 8 | 6 | 57 |
| Kansas | 2 | 6 | 56 |
| Kentucky | 5 | 9 | 43 |
| Louisiana | 2 | 7 | 27 |
| Maine | 4 | 1 | 10 |
| Maryland | 7 | 9 | 48 |
| Massachusetts | 8 | 2 | 50 |
| Michigan | 41 | 14 | 60 |
| Minnesota | 9 | 3 | 41 |
| Mississippi | 1 | 13 | 24 |
| Missouri | 7 | 9 | 49 |
| Montana | 0 | 2 | 22 |
| Nebraska | 1 | 3 | 31 |
| Nevada | 1 | 1 | 12 |
| New Hampshire | 2 | 0 | 9 |
| New Jersey | 5 | 1 | 34 |
| New Mexico | 1 | 4 | 25 |
| New York | 8 | 1 | 60 |
| North Carolina | 9 | 12 | 63 |
| North Dakota | 0 | 0 | 12 |
| Ohio | 29 | 5 | 79 |
| Oklahoma | 2 | 6 | 38 |
| Oregon | 6 | 1 | 32 |
| Pennsylvania | 51 | 12 | 103 |
| Rhode Island | 1 | 0 | 4 |
| South Carolina | 7 | 8 | 38 |
| South Dakota | 0 | 2 | 19 |
| Tennessee | 6 | 10 | 45 |
| Texas | 16 | 17 | 96 |
| Utah | 1 | 6 | 24 |
| Vermont | 1 | 0 | 6 |
| Virginia | 11 | 10 | 63 |
| Washington | 7 | 2 | 37 |
| West Virginia | 3 | 1 | 18 |
| Wisconsin | 22 | 6 | 80 |
| Wyoming | 0 | 0 | 18 |
| Territories | 0 | 0 | 0 |
States with Highest Tons of Waste Per Person
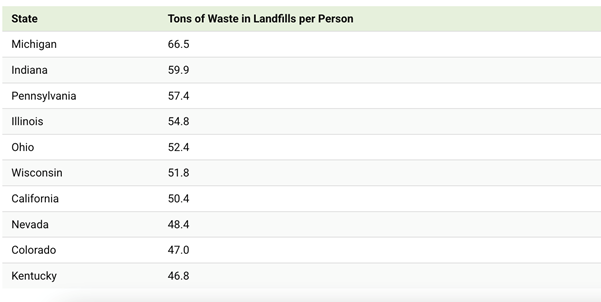
States in the Upper Midwest and eastern industrial regions generate the highest amount of waste per capita, with Michigan, Indiana, Pennsylvania, Illinois, and Ohio leading the list. Michigan, in particular, receives a significant amount of out-of-state and even international waste, largely due to its low landfill costs. Under the U.S. Constitution’s Commerce Clause, waste is legally classified as a commodity, meaning states and counties cannot impose restrictions on its import or export. This allows Michigan to accept large volumes of trash from other states and even Canada. Recycling remains a challenge for the state, with Michigan’s recycling rate standing at approximately 18%, significantly lower than the national average of 32%. This gap highlights the need for improved waste diversion strategies and sustainable waste management initiatives (Bruno Venditti, 2022).
States with Fewest Tons of Waste Per Person
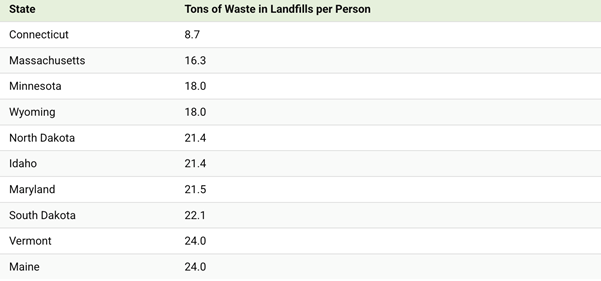
Less densely populated states, including Wyoming, Idaho, Maine, Vermont, and North and South Dakota, rank among those with the lowest landfill waste per capita. Due to their smaller populations and lower waste generation, these states rely less on landfill space compared to more industrialized regions.
Connecticut, in particular, has the lowest amount of buried waste per resident, with only 8.7 tons per person. This is primarily because the state accepts significantly less trash by volume than most others. Connecticut also emphasizes alternative waste management strategies such as recycling and waste-to-energy programs, reducing its reliance on landfills (Venditti, 2022).
Key Observations:
- California leads with the highest number of total landfills (299) and operational LFG energy projects (53), reflecting its extensive waste management infrastructure.
- Pennsylvania has a significant number of operational projects (51) and total landfills (103), indicating its role as a major waste management hub.
- Michigan stands out in the Midwest with 41 operational projects, showcasing its commitment to LFG energy utilization.
- Wisconsin also demonstrates a strong emphasis on LFG energy projects, with 22 operational projects out of 80 total landfills.
- States like Nevada and Vermont, despite having fewer total landfills, have operational LFG projects, indicating efficient utilization of available resources.
Waste Export Destinations: Where Does U.S. Garbage Go?
A recent report by the Solid Waste Environmental Excellence Protocol (SWEEP) highlights a pressing issue: the 2,000 active landfills across the United States are nearing full capacity. With the country generating over 258 million tons of municipal solid waste (MSW) annually, waste management is becoming a critical concern.
Of this total waste, approximately 34.6% is recycled, a portion is incinerated for energy recovery, and the remaining waste is sent to landfills. However, as landfill space becomes increasingly limited, waste management strategies must evolve to include more recycling, composting, and innovative waste-to-energy solutions.
The growing waste problem underscores the need for sustainable waste management policies and investment in alternative solutions to reduce landfill dependency. Without such measures, many landfills could reach capacity, leading to environmental and logistical challenges in waste disposal (Joe McCarthy, 2018).
Waste Export to Other Countries:
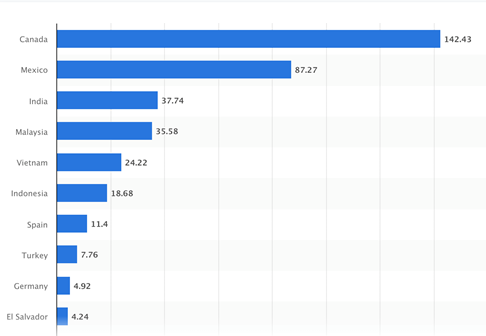
In 2024, the United States exported approximately 903 million pounds of recovered plastic, a slight decrease from 921 million pounds of 2023.
Primary Destinations:
- Canada: 308 million pounds of U.S. plastic waste in 2024.
- Mexico: Received 190 million pounds during the same period.
Collectively, Canada and Mexico accounted for over 55% of U.S. plastic waste exports in the 2024.
Other Notable Importers:
- Malaysia: Imported 78 million pounds.
- India: Received 83 million pounds.
- Vietnam: Took in 53 million pounds.
- Indonesia: Imported 41 million pounds.
- India: Imported 83 million pounds.
The figure below indicates the data (in 1,000 metric tons) of leading destinations for plastic scrap exports from the United States in 2024, by country (statista, 2024).
Waste Export within the State:
Not all states in the U.S. have the capacity to manage their waste internally. Many states, particularly those with high population densities and limited landfill space, export their waste to neighbouring states or even internationally. This section provides a detailed breakdown of waste export destinations by state, analysing why certain states send their waste elsewhere and where it ultimately goes.
Northeast Region
New York
- Primary Export Destinations: Pennsylvania, Virginia, Ohio
- Reason for Exporting: Limited landfill space due to high urbanization leads New York to rely on Pennsylvania’s larger landfills, which offer lower disposal costs. Waste is also shipped to Virginia and Ohio for similar reasons.
- Waste Exported Annually: Over 6 million tons of municipal solid waste (MSW).
New Jersey
- Primary Export Destinations: Pennsylvania, Ohio, South Carolina
- Reason for Exporting: High waste production and strict environmental regulations limit landfill expansion in New Jersey. Pennsylvania and Ohio provide lower-cost landfill options, while some waste is sent to South Carolina for specialized facilities.
- Waste Exported Annually: Approximately 4 million tons.
Massachusetts
- Primary Export Destinations: New Hampshire, Ohio, Virginia
- Reason for Exporting: Reduced landfill capacity due to environmental restrictions leads Massachusetts to ship waste to New Hampshire, Ohio, and Virginia.
- Waste Exported Annually: Around 2.5 million tons.
Connecticut & Rhode Island
- Primary Export Destinations: Ohio, Pennsylvania, South Carolina
- Reason for Exporting: Few active landfills result in most waste being transported to Ohio and Pennsylvania, where landfill space is more abundant, or to South Carolina for waste-to-energy disposal.
- Waste Exported Annually: Approximately 1.5 million tons.
Mid-Atlantic and Southeast
Pennsylvania
- Receives Waste From: New York, New Jersey, Maryland, Massachusetts
- Reason for Accepting Waste: High landfill capacity makes Pennsylvania a preferred destination for out-of-state waste.
- Amount of Waste Imported Annually: Over 8 million tons, making it the largest waste importer in the U.S.
Virginia
- Receives Waste From: New York, Maryland, Washington D.C., North Carolina
- Reason for Accepting Waste: Extensive landfill space and relatively low tipping fees make Virginia a top choice for out-of-state waste disposal.
- Amount of Waste Imported Annually: Over 5 million tons.
North Carolina & South Carolina
- Receives Waste From: Massachusetts, Connecticut, New Jersey
- Reason for Accepting Waste: Some imported waste goes to specialized waste-to-energy facilities rather than traditional landfills.
- Amount of Waste Imported Annually: Over 3 million tons.
Midwest
Ohio
- Receives Waste From: New York, Pennsylvania, New Jersey, Massachusetts
- Reason for Accepting Waste: Large landfill sites with relatively low fees attract waste from the Northeast for lower-cost disposal.
- Amount of Waste Imported Annually: Around 4.5 million tons.
Michigan
- Receives Waste From: Canada, Illinois, Ohio, Indiana
- Reason for Accepting Waste: Some of the largest landfills in the country and acceptance of international waste from Canada.
- Amount of Waste Imported Annually: Over 2 million tons.
Illinois
- Receives Waste From: Indiana, Missouri, Wisconsin
- Reason for Accepting Waste: Significant landfill capacity serves as a regional hub for waste disposal.
- Amount of Waste Imported Annually: Around 1.5 million tons.
South and Gulf Coast
Texas
- Exports Waste To: Mexico
- Reason for Exporting: Extensive waste management infrastructure, with some hazardous and industrial waste sent to Mexico for specialized processing.
- Amount of Waste Exported Annually: Around 1 million tons (including hazardous waste).
Louisiana
- Exports Waste To: Other Gulf Coast States
- Reason for Exporting: A mix of local disposal and waste exports for industrial and hazardous waste.
Western U.S.
California
- Exports Waste To: Oregon, Nevada, Arizona
- Reason for Exporting: Strong landfill network, but exports some waste to neighbouring states for lower disposal costs.
- International Waste Export Destinations: Malaysia, India, Mexico, Canada
- Amount of Waste Exported Annually: Over 75,000 metric tons of plastic waste alone.
Nevada
- Receives Waste From: California
- Reason for Accepting Waste: Extensive landfill space, including the largest landfill in the U.S. (Apex Regional Landfill), serving as a major waste hub.
Alaska & Hawaii
Alaska
- Waste Management Challenge: Remote location and lack of large-scale landfills lead many small communities to rely on localized dump sites. Some waste is transported to Washington state for disposal.
Hawaii
- Waste Export Destinations: California, Oregon
- Reason for Exporting: Limited landfill space necessitates shipping a portion of waste to the mainland for disposal.
Additional States: Waste Export and Import Data Inside and Outside
Georgia
- Exports Waste To: Non-OECD countries (primarily Southeast Asia)
- Reason for Exporting: Georgia exports significant plastic waste to countries like Malaysia and Thailand due to domestic recycling limitations.
- Amount of Waste Exported Annually: Over 200,000 metric tons of plastic waste.
Tennessee
- Receives Waste From: Kentucky, Alabama, Georgia
- Reason for Accepting Waste: Tennessee has several large landfills that accept out-of-state waste, particularly from neighbouring states with more stringent landfill regulations.
- Amount of Waste Imported Annually: Around 2.2 million tons.
Missouri
- Receives Waste From: Illinois, Arkansas, Kansas
- Reason for Accepting Waste: Missouri has moderate landfill fees, making it a viable option for neighbouring states.
- Amount of Waste Imported Annually: Around 1.8 million tons.
Florida
- Exports Waste To: Caribbean nations, India, Vietnam
- Reason for Exporting: Florida exports plastic waste due to recycling constraints and limited local processing capacity. Some waste is also exported for disposal in the Caribbean.
- Amount of Waste Exported Annually: Approximately 120,000 metric tons of plastic waste.
Washington
- Exports Waste To: Canada, China, South Korea
- Reason for Exporting: Washington sends recyclables, including plastic waste, to Canada and other countries due to strong trade ties and limited local processing.
- Amount of Waste Exported Annually: Over 150,000 metric tons of plastic waste.
Oregon
- Receives Waste From: California, Washington
- Reason for Accepting Waste: Oregon has landfill capacity and waste-to-energy facilities that attract out-of-state waste.
- Amount of Waste Imported Annually: Over 1.5 million tons.
Colorado
- Exports Waste To: Texas, Nebraska
- Reason for Exporting: Limited landfill capacity and cost considerations drive waste exports to states with lower disposal fees.
- Amount of Waste Exported Annually: Around 700,000 tons.
Arizona
- Receives Waste From: California, Nevada
- Reason for Accepting Waste: Arizona’s large landfill sites and lower tipping fees make it a common destination for California’s waste.
- Amount of Waste Imported Annually: Over 2 million tons.
New Mexico
- Exports Waste To: Texas
- Reason for Exporting: Limited landfill infrastructure leads to waste shipments to Texas for disposal.
- Amount of Waste Exported Annually: Approximately 500,000 tons.
Highest Ocean Plastic Waste Polluters in 2025
In 2025, Asia is expected to contribute 81% of all ocean plastic pollution, making it the largest source of marine plastic waste. This is primarily due to rapid industrialization, high plastic consumption, and inadequate waste management infrastructure. With 30% of the world’s landmass and 48 countries, Asia faces significant challenges in handling plastic waste, especially in coastal regions where improper disposal leads to direct ocean pollution. Countries like China, Indonesia, the Philippines, Vietnam, and Thailand rank among the highest polluters due to inefficient waste collection, high population densities, and major river systems transporting plastic into marine ecosystems. India, despite growing environmental policies, also contributes significantly, with the Ganges River acting as a major conduit for plastic waste. Tourism-heavy nations like Thailand and developing economies like Vietnam and Indonesia struggle to balance economic growth with sustainable waste management, further worsening the crisis (Caoimhe Donnelly, 2025).
Factors Behind Top Ocean Polluters in 2025
Why do countries like the Philippines, India, Malaysia, and China contribute so much to ocean pollution, and what can be done to reduce it? Understanding the key factors behind ocean plastic pollution can help in developing global solutions.
Poor waste management infrastructure: Countries like Myanmar, Bangladesh, and Indonesia struggle with inadequate waste management systems. Overflowing landfills and improper disposal methods lead to massive amounts of plastic waste entering the ocean.
Single-use plastics: In nations such as India, Thailand, and Vietnam, where many people live near or below the poverty line, single-use plastics are a cheap and accessible option. However, their widespread use and improper disposal contribute significantly to ocean pollution.
Limited recycling infrastructure: The Philippines, Malaysia, and Brazil lack sufficient recycling centres, making it difficult to properly process plastic waste. In the Philippines alone, an estimated 70% of the population does not have access to proper disposal facilities, resulting in huge amounts of plastic ending up in the ocean.
Importation of foreign waste: China, Indonesia, and Thailand have historically been major recipients of plastic waste from wealthier countries. Without proper recycling and waste management facilities, these imports add to existing pollution problems.
Tourism waste: Vietnam, Thailand, and Malaysia experience a surge in waste due to tourism. A 2022 study estimated that the tourism industry generates 35 million tonnes of waste annually, adding to the plastic pollution crisis (Donnelly, 2025).
The World’s Most Polluted Oceans
Pollution in the world’s oceans has reached alarming levels, with plastic waste, industrial activities, and overfishing severely impacting marine ecosystems. The Pacific Ocean, Indian Ocean, and Atlantic Ocean are the three most polluted, each facing unique environmental challenges.
1. The Pacific Ocean
The Pacific Ocean holds the unfortunate title of being the most polluted, with an estimated 234.80 million pounds of plastic waste contaminating its waters. This pollution significantly affects marine life, particularly through coral bleaching, which threatens ecosystems such as the Great Barrier Reef. Reports indicate that coral bleaching rates are rising between 19% and 38% annually, preventing reefs from recovering.
A major contributor to Pacific pollution is the Great Pacific Garbage Patch, the world’s largest accumulation of marine debris, mainly consisting of discarded fishing equipment and plastic waste. However, what is visible on the surface is just a fraction of the problem—70% of marine debris is hidden beneath the surface. In a striking example, a plastic bag was even discovered in the Mariana Trench, the deepest point in the ocean. Additionally, the Pacific Ocean suffers from the highest levels of overfishing, both legally and illegally, further threatening marine ecosystems.
2. The Indian Ocean
Despite being home to incredible marine biodiversity, the Indian Ocean ranks as the second most polluted in the world. It receives a staggering 11 million tonnes of plastic waste annually, with major contributors being Indonesia, Thailand, and India—countries also ranked among the top global plastic polluters.
One of the biggest sources of pollution in the Indian Ocean is its connection to the Ganges and Indus rivers, two of the world’s most polluted rivers, which carry massive amounts of waste from inland cities into the ocean. Additionally, this ocean accounts for 40% of the world’s offshore oil production, making it highly susceptible to oil spills, which continue to devastate marine life despite a decrease in recent years.
3. The Atlantic Ocean
The Atlantic Ocean ranks third in terms of pollution, mainly due to the massive amounts of plastic transported by major rivers such as the Amazon, Mississippi, and Congo. These rivers act as conduits, carrying inland waste directly into the ocean.
The Atlantic is home to two massive garbage patches, located in both the North and South Atlantic. Research suggests that plastic pollution in this ocean is 10 times higher than previously thought, with an alarming study revealing 7,000 micro plastics per cubic meter in the surface waters. The increasing amount of plastic waste, coupled with rising pollution from urban runoff and industrial waste, continues to make the Atlantic a highly contaminated ocean (Caoimhe, 2025).
Solutions to the Waste Crisis
The global waste crisis continues to escalate, driven by increasing consumption, inefficient waste management, and the environmental impact of non-biodegradable materials. Addressing this issue requires a multi-faceted approach, including government intervention, technological innovation, and the adoption of sustainable products like CleanGO CG-100.
Government Regulations and Initiatives
Governments worldwide have implemented policies to manage landfill shortages and reduce dependency on waste exports. Many regions have introduced bans on single-use plastics and provided incentives to encourage recycling and composting. International agreements, such as MARPOL and the London Convention, play a crucial role in curbing ocean pollution by restricting waste dumping in marine environments. These regulations create a framework for sustainable waste management and push industries toward eco-friendly practices.
Technological Advancements in Waste Management
Innovation is transforming waste management, improving efficiency and sustainability. Modern landfill designs incorporate advanced containment and methane capture systems to minimize environmental damage. The development of plastic alternatives and biodegradable materials helps reduce long-term pollution. AI and automation are increasingly used in waste sorting and recycling, making the process faster, more accurate, and less labor-intensive. These technological solutions support a circular economy where waste materials are repurposed rather than discarded.
CleanGO CG-100 as a Greener Solution
CleanGO CG-100 offers a revolutionary approach to reducing waste, particularly in the cleaning industry. This biodegradable, non-toxic cleaning solution minimizes chemical waste that often contaminates landfills and water systems. By replacing harsh industrial and household cleaners with an environmentally friendly alternative, CleanGO CG-100 contributes to overall waste reduction. Its integration into broader waste management strategies can further support sustainability efforts, encouraging businesses and consumers to adopt greener practices.
Conclusion:
The growing crisis of ocean pollution and waste mismanagement underscores the urgent need for global action. With over 8 to 14 million metric tons of plastic entering oceans annually and projections indicating a potential tripling of this figure by 2040, the environmental and societal impacts are dire. The U.S. contributes significantly to this crisis, generating 12% of the world’s municipal solid waste despite having less than 5% of the global population. Landfills in the U.S. are nearing capacity, with 80% of landfill waste being recyclable, yet mismanagement persists. States like Pennsylvania, Ohio, and Virginia import vast amounts of waste, while others, such as New York and California, export their trash due to limited landfill space. Internationally, the U.S. ships millions of tons of plastic waste to countries like Canada, Mexico, and Malaysia, exacerbating global pollution. Meanwhile, Asian nations, particularly China, Indonesia, and the Philippines, contribute over 50% of ocean plastic pollution due to inadequate waste infrastructure and rapid industrialization. The Great Pacific Garbage Patch, spanning 1.6 million square kilometres, symbolizes the scale of this crisis. Without immediate action—through improved waste management, stricter regulations, and global cooperation—marine ecosystems, human health, and economies will face irreversible damage. The time to act is now, before the oceans are irreparably choked by waste.
References:
[Online] / auth. Monica Sanders. – 2025. – https://www.forbes.com/sites/monicasanders/2025/01/28/how-america-became-the-worlds-trash-leader/.
[Online] / auth. Jeff Turrentine. – 2019. – https://www.earthisland.org/journal/index.php/articles/entry/united-states-most-wasteful-country-garbage/?utm_source=google&utm_medium=paid&utm_campaign=tfd_dsa&gad_source=1&gclid=CjwKCAjwvr–BhB5EiwAd5YbXsmQT9E0j84XL5Dz-zdiLC9gG3n3EDncx4m2k8VhxGAdhiyBNrMhKRoCxa4QAvD_BwE.
[Online] / auth. Chloe Fisher. – 2024. – https://www.rts.com/blog/plastic-pollution-in-the-ocean-facts-and-statistics/.
[Online] / auth. Johnny Wood. – 2018. – https://www.weforum.org/stories/2018/09/asia-s-plastic-problem-is-choking-the-world-s-oceans-here-s-how-to-fix-it/.
[Online] / auth. Jenny Vaughan. – 2018. – https://phys.org/news/2018-06-plastic-wasteland-asia-ocean-pollution.html.
[Online] / auth. Louis Lugas. – 2023. – https://www.visualcapitalist.com/cp/visualized-ocean-plastic-waste-pollution-by-country/.
[Online] / auth. Hannah Ritchie, Veronika Samborska, Max Roser. – 2022. – https://ourworldindata.org/plastic-pollution#:~:text=pollution%20%7C%20CC%20BY-,Around%200.5%25%20of%20plastic%20waste%20ends%20up%20in%20the%20ocean,plastic%20enter%20the%20oceans%20annually.
[Online] / auth. Chloe Fisher. – 2024. – https://www.rts.com/blog/plastic-pollution-in-the-ocean-facts-and-statistics/.
[Online] / auth. NOAA. – 2024. – https://oceanservice.noaa.gov/facts/pollution.html.
[Online] / auth. Wikipedia. – 2024. – https://en.wikipedia.org/wiki/Great_Pacific_Garbage_Patch.
[Online] / auth. Rachael Zimlich. – 2015. – https://www.waste360.com/waste-management-business/regional-landfill-capacity-problems-do-not-equate-to-a-national-shortage.
[Online] / auth. Statista. – 2024. – https://www.statista.com/statistics/1360264/us-largest-landfills-by-capacity/.
[Online] / auth. Statista. – 2024. – https://www.statista.com/statistics/1360264/us-largest-landfills-by-capacity/ .
[Online] / auth. EPA. – 2024. – https://www.epa.gov/lmop/project-and-landfill-data-state.
[Online] / auth. Bruno Venditti. – 2022. – https://www.visualcapitalist.com/sp/land-of-waste-american-landfills-by-state/.
[Online] / auth. Joe McCarthy. – 2018. – https://www.globalcitizen.org/en/content/us-landfills-are-filling-up/.
[Online] / auth. statista. – 2024. – https://www.statista.com/statistics/1033852/plastic-waste-us-exports-destination-by-country/#:~:text=Canada%20is%20by%20far%20the,tons%20of%20plastic%20scraps%20imported.
[Online] / auth. Caoimhe Donnelly. – 2025. – https://www.greenmatch.co.uk/ocean-pollution-facts.
[Online] / auth. Donnelly. – 2025. – https://www.greenmatch.co.uk/ocean-pollution-facts.
[Online] / auth. Caoimhe. – 2025. – https://www.greenmatch.co.uk/ocean-pollution-facts.
[Online] / auth. Venditti Bruno. – 2022. – https://www.visualcapitalist.com/sp/land-of-waste-american-landfills-by-state/.